Advanced QGIS Visualization & AI-Aided Styling for Urban Spatial Storytelling
Maps that say something, and look good doing it.
A 2-week live cohort for urban professionals who want their maps to communicate clearly to clients, teams, and stakeholders. Four live sessions with Juan Pablo, recordings within 3 hours, AI-aided workflows, and 2 months of materials access.
Maps are arguments, not just aesthetics.
We teach urban storytelling through two lenses: maps that communicate the right information, and maps that look good. This order matters.
A map can be aesthetically strong, but if it doesn't communicate an idea clearly, it fails its purpose.
AI is built into the workflow as a productivity tool. The decisions about what matters, and how to communicate it, remain yours.
By the end of this course, you will be able to:
The goal is not to create "perfect" maps in an academic sense, but to create clear, professional maps that communicate effectively to clients, teams, and stakeholders.
Turn messy spatial data into clear, focused maps that say something specific.
Decide what matters and confidently remove what doesn't.
Structure maps so people understand them in seconds.
Use QGIS to build clean, professional visualizations from scratch.
Apply AI to speed up styling, expressions, and rule-based logic.
Produce maps ready for clients, reports, and presentations.
Three modules. One progression: think · build · refine.
First define the message and structure. Then build the map correctly in QGIS. Finally, refine the visual design.
Define what the map needs to say
Goal: Stop making maps that show everything. Start making maps that say something.
- Define a clear message before opening QGIS
- Choose the right map type (baseline, comparative, composite)
- Decide which layers are actually needed, and which to cut
- Structure internal and external hierarchy
- Understand what should stand out, and why
Build the map correctly in QGIS
Goal: Use QGIS as a tool for clarity, not just output.
- Choose the right visualization based on data type and geometry
- Build maps using categorized, graduated, and rule-based styling
- Use labels to improve readability, not clutter
- Apply AI to create expressions and styling rules faster
- Export maps that are clean and consistent
- Automate outputs using Atlas
Make the map readable and professional
Goal: Make your maps easy to understand at a glance.
- Use basemaps to provide context without noise
- Clearly define study area vs. context
- Manage multiple layers using fills (color, transparency, patterns)
- Manage strokes (boundaries, hierarchy, relationships)
- Avoid common visual mistakes: too many colors, unclear overlaps, weak focus
Limited seats. Launch pricing – save up to €150.
AI is the new layer in your QGIS workflow
It cuts hours off styling and rule-based logic. Not by replacing your judgment, but by translating your intent into working syntax instantly.
The decisions that matter (what the map says, what to highlight, what to cut) are yours. The syntax is a translation problem, and AI is now very good at translation.
You'll learn to describe what you want in plain language and get back rule-based expressions, styling rules, and SQL filters that work the first time.
30 minutes searching forums for why your expression isn't matching the right buildings.
"Highlight buildings under 50 sqm in pink, fade context to gray, only within 200m of transit." Working expression in 30 seconds.
Manually tweaking categorized symbology classes one by one.
Generate styling rules from your data and intent. Iterate by chatting, not clicking.
Two weeks. Four live sessions. Cohort #1 starts June 2026.
All live sessions run at 4:00 PM CEST / 10:00 AM EDT. Recordings available within 3 hours.
Save up to 30% at launch pricing.
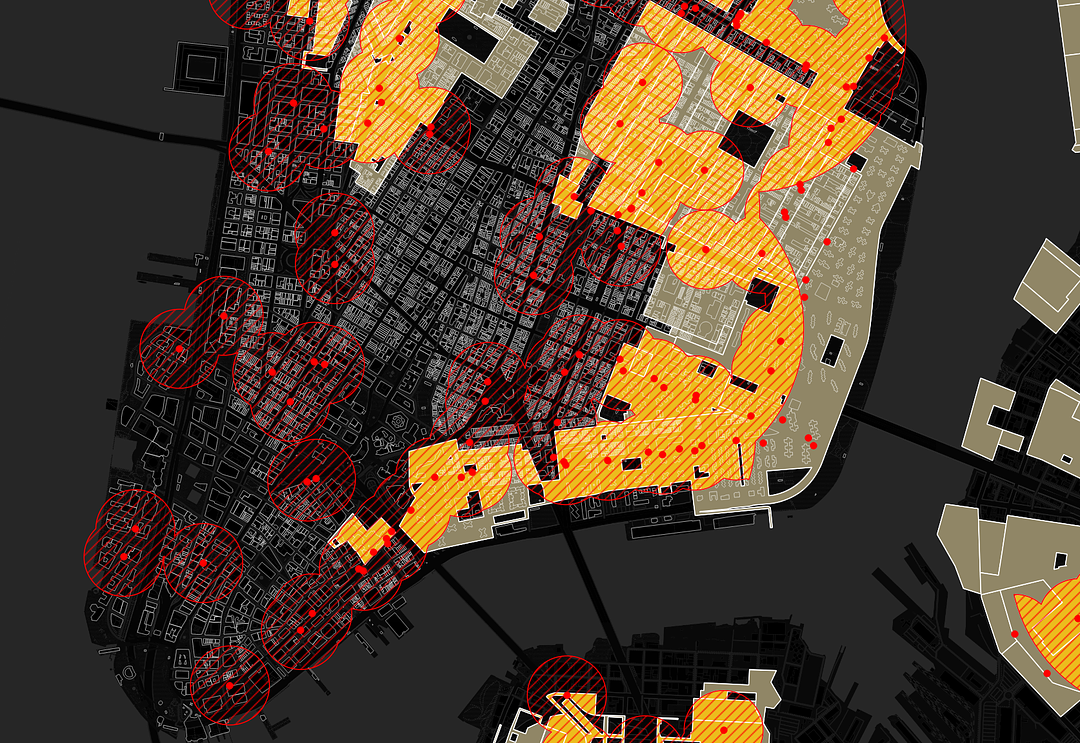
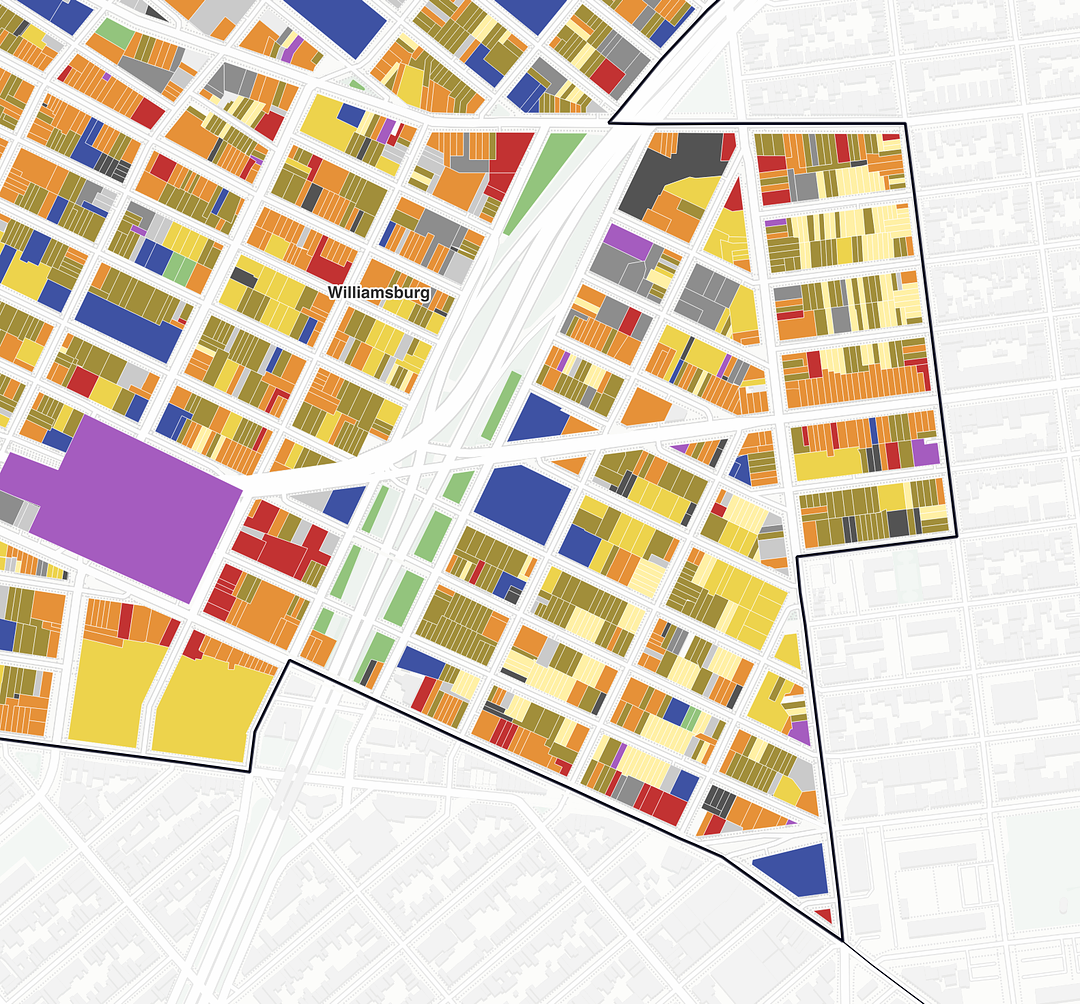
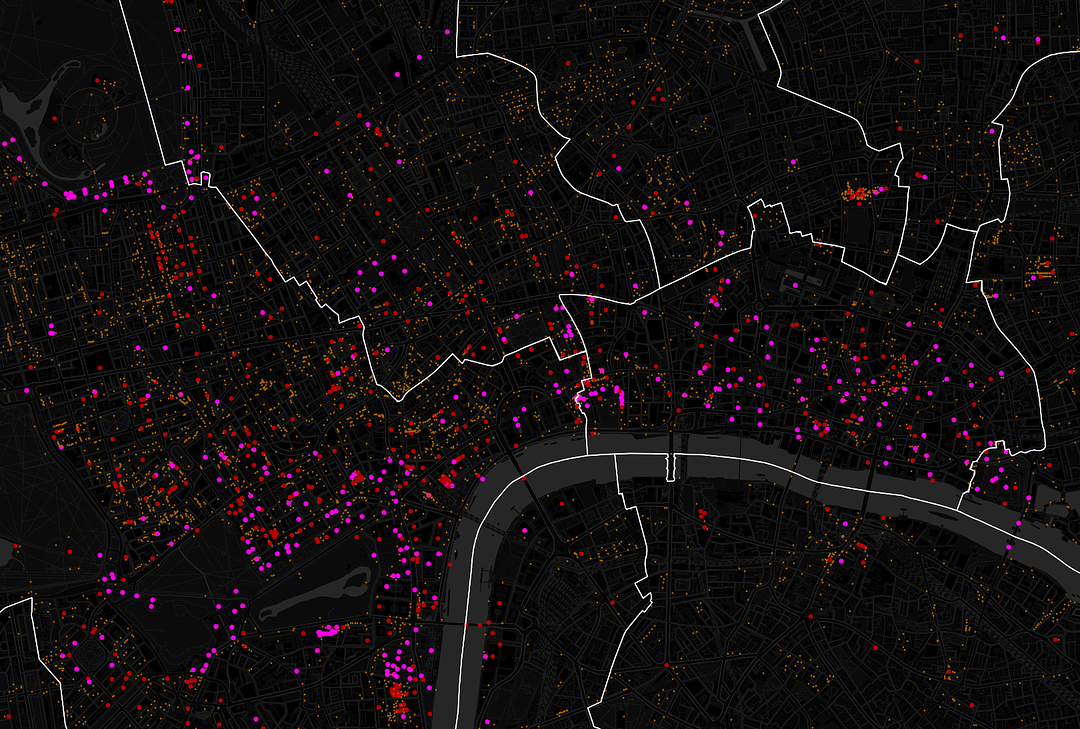
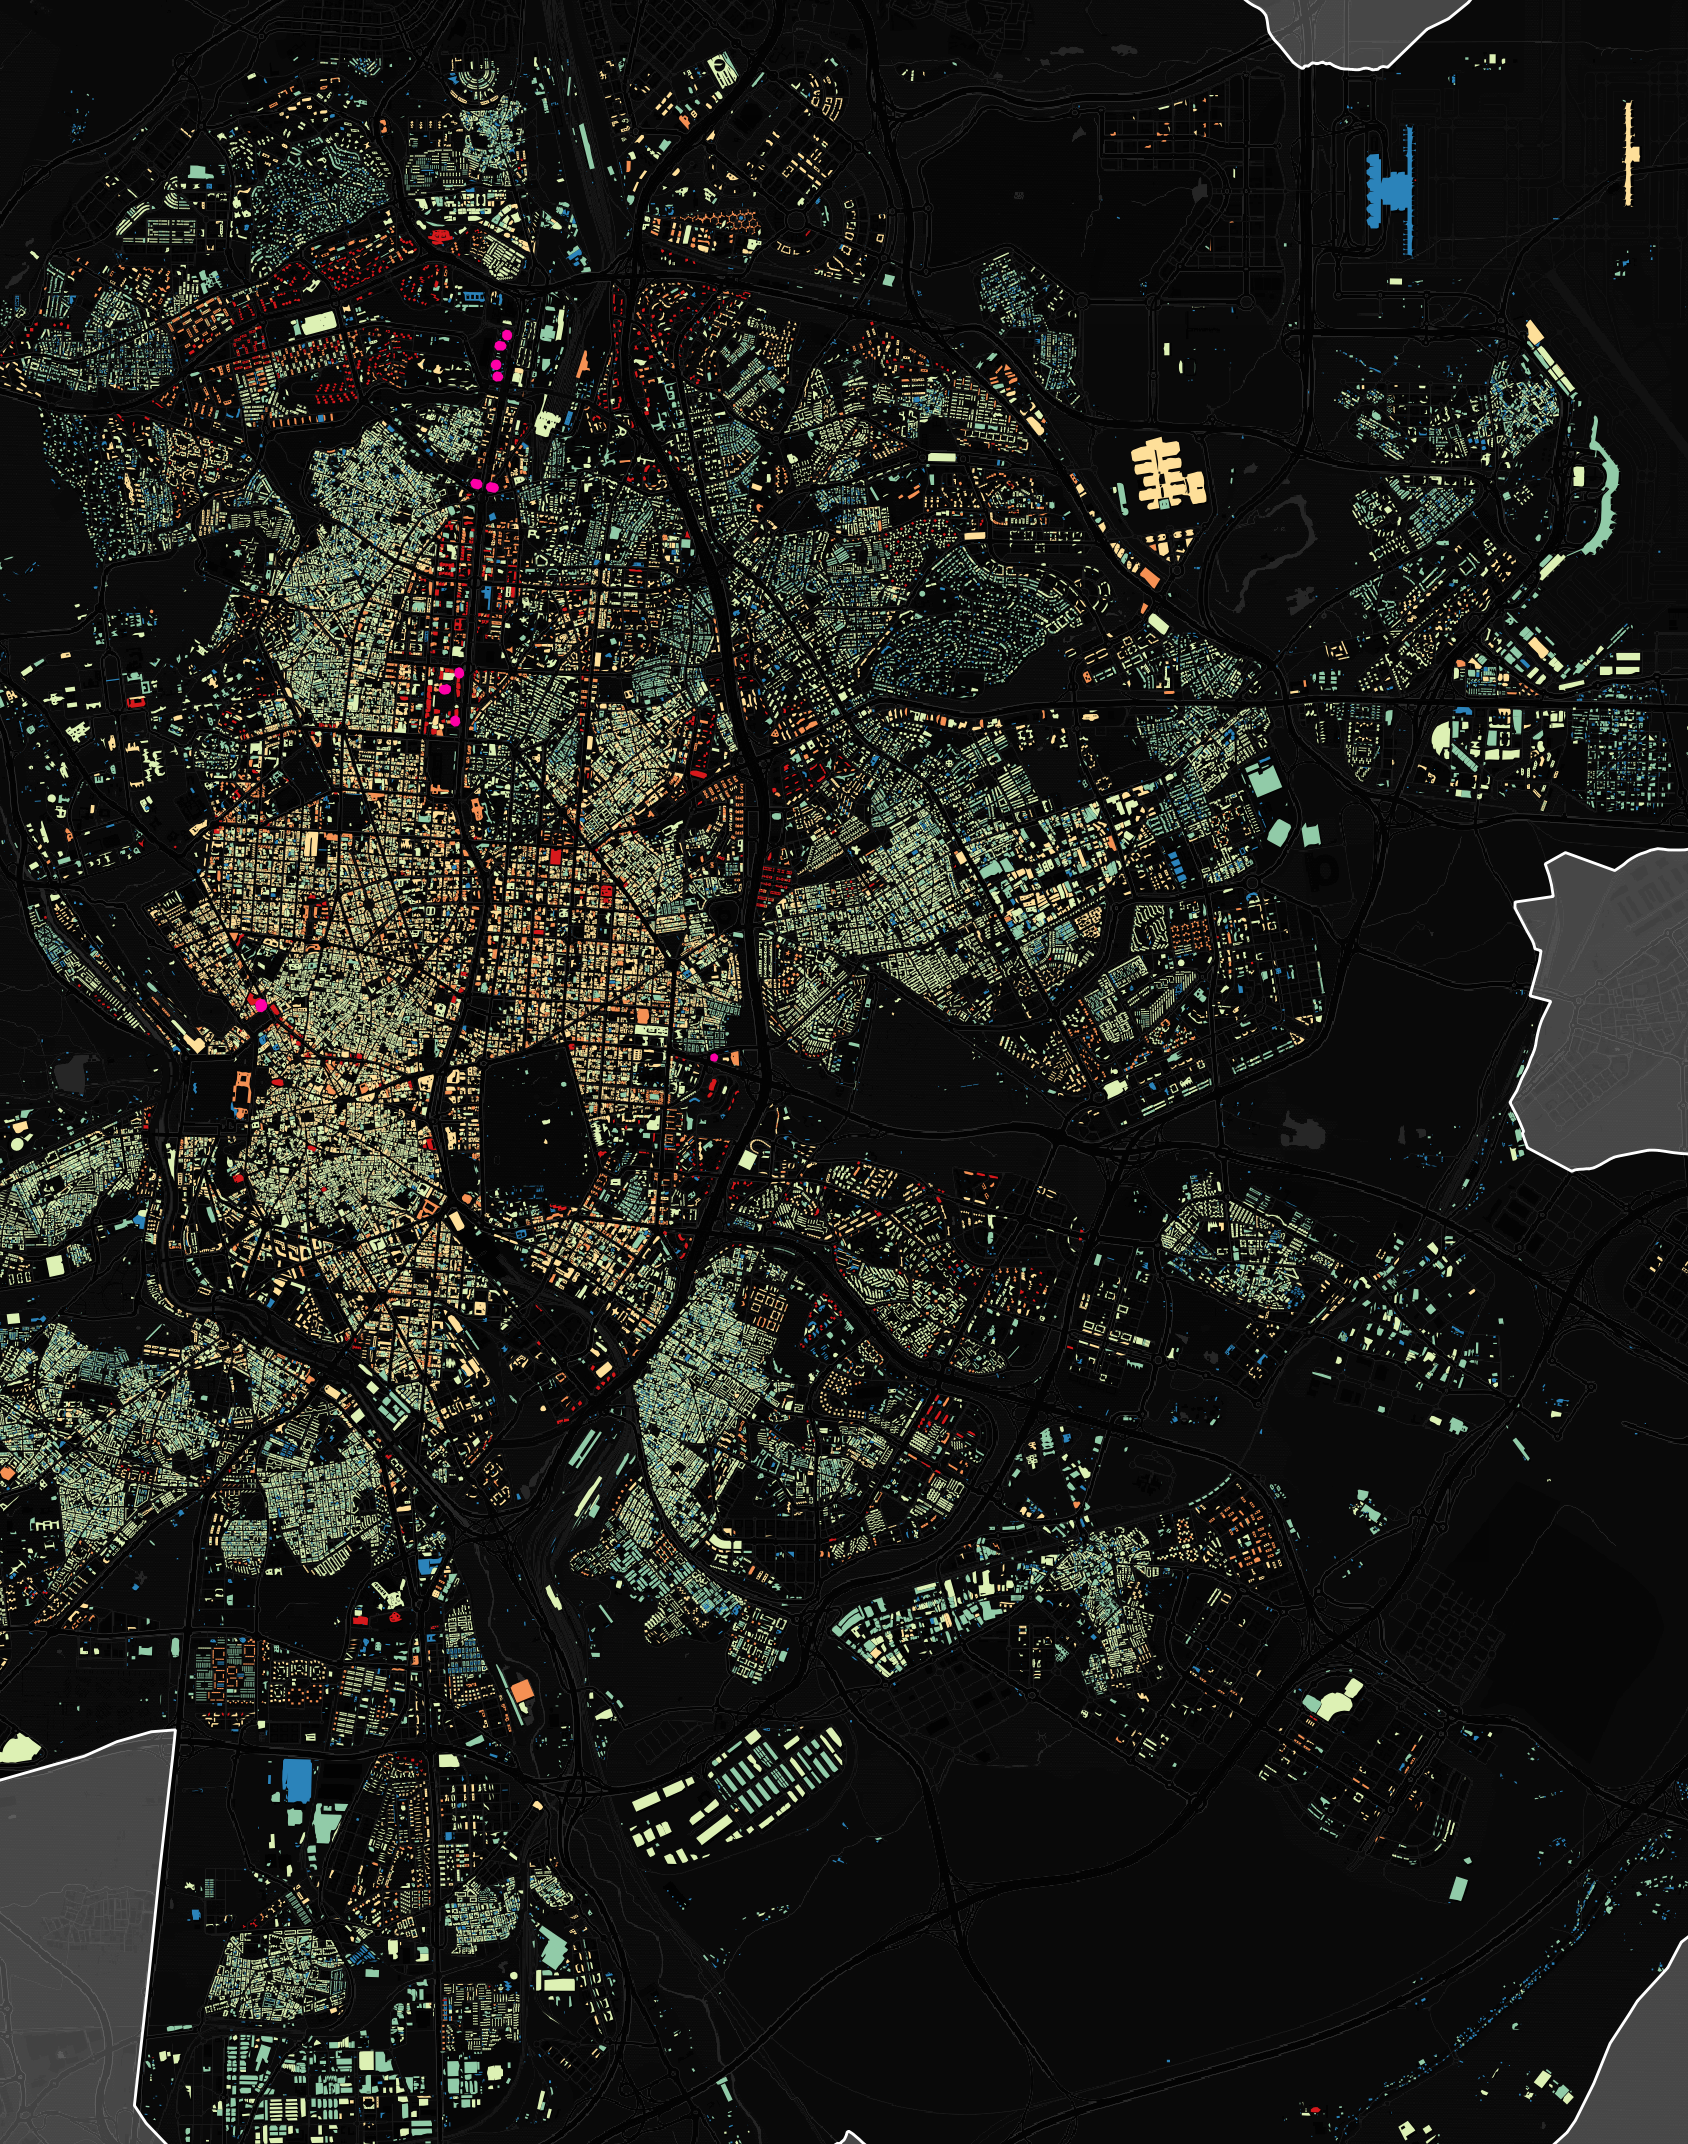
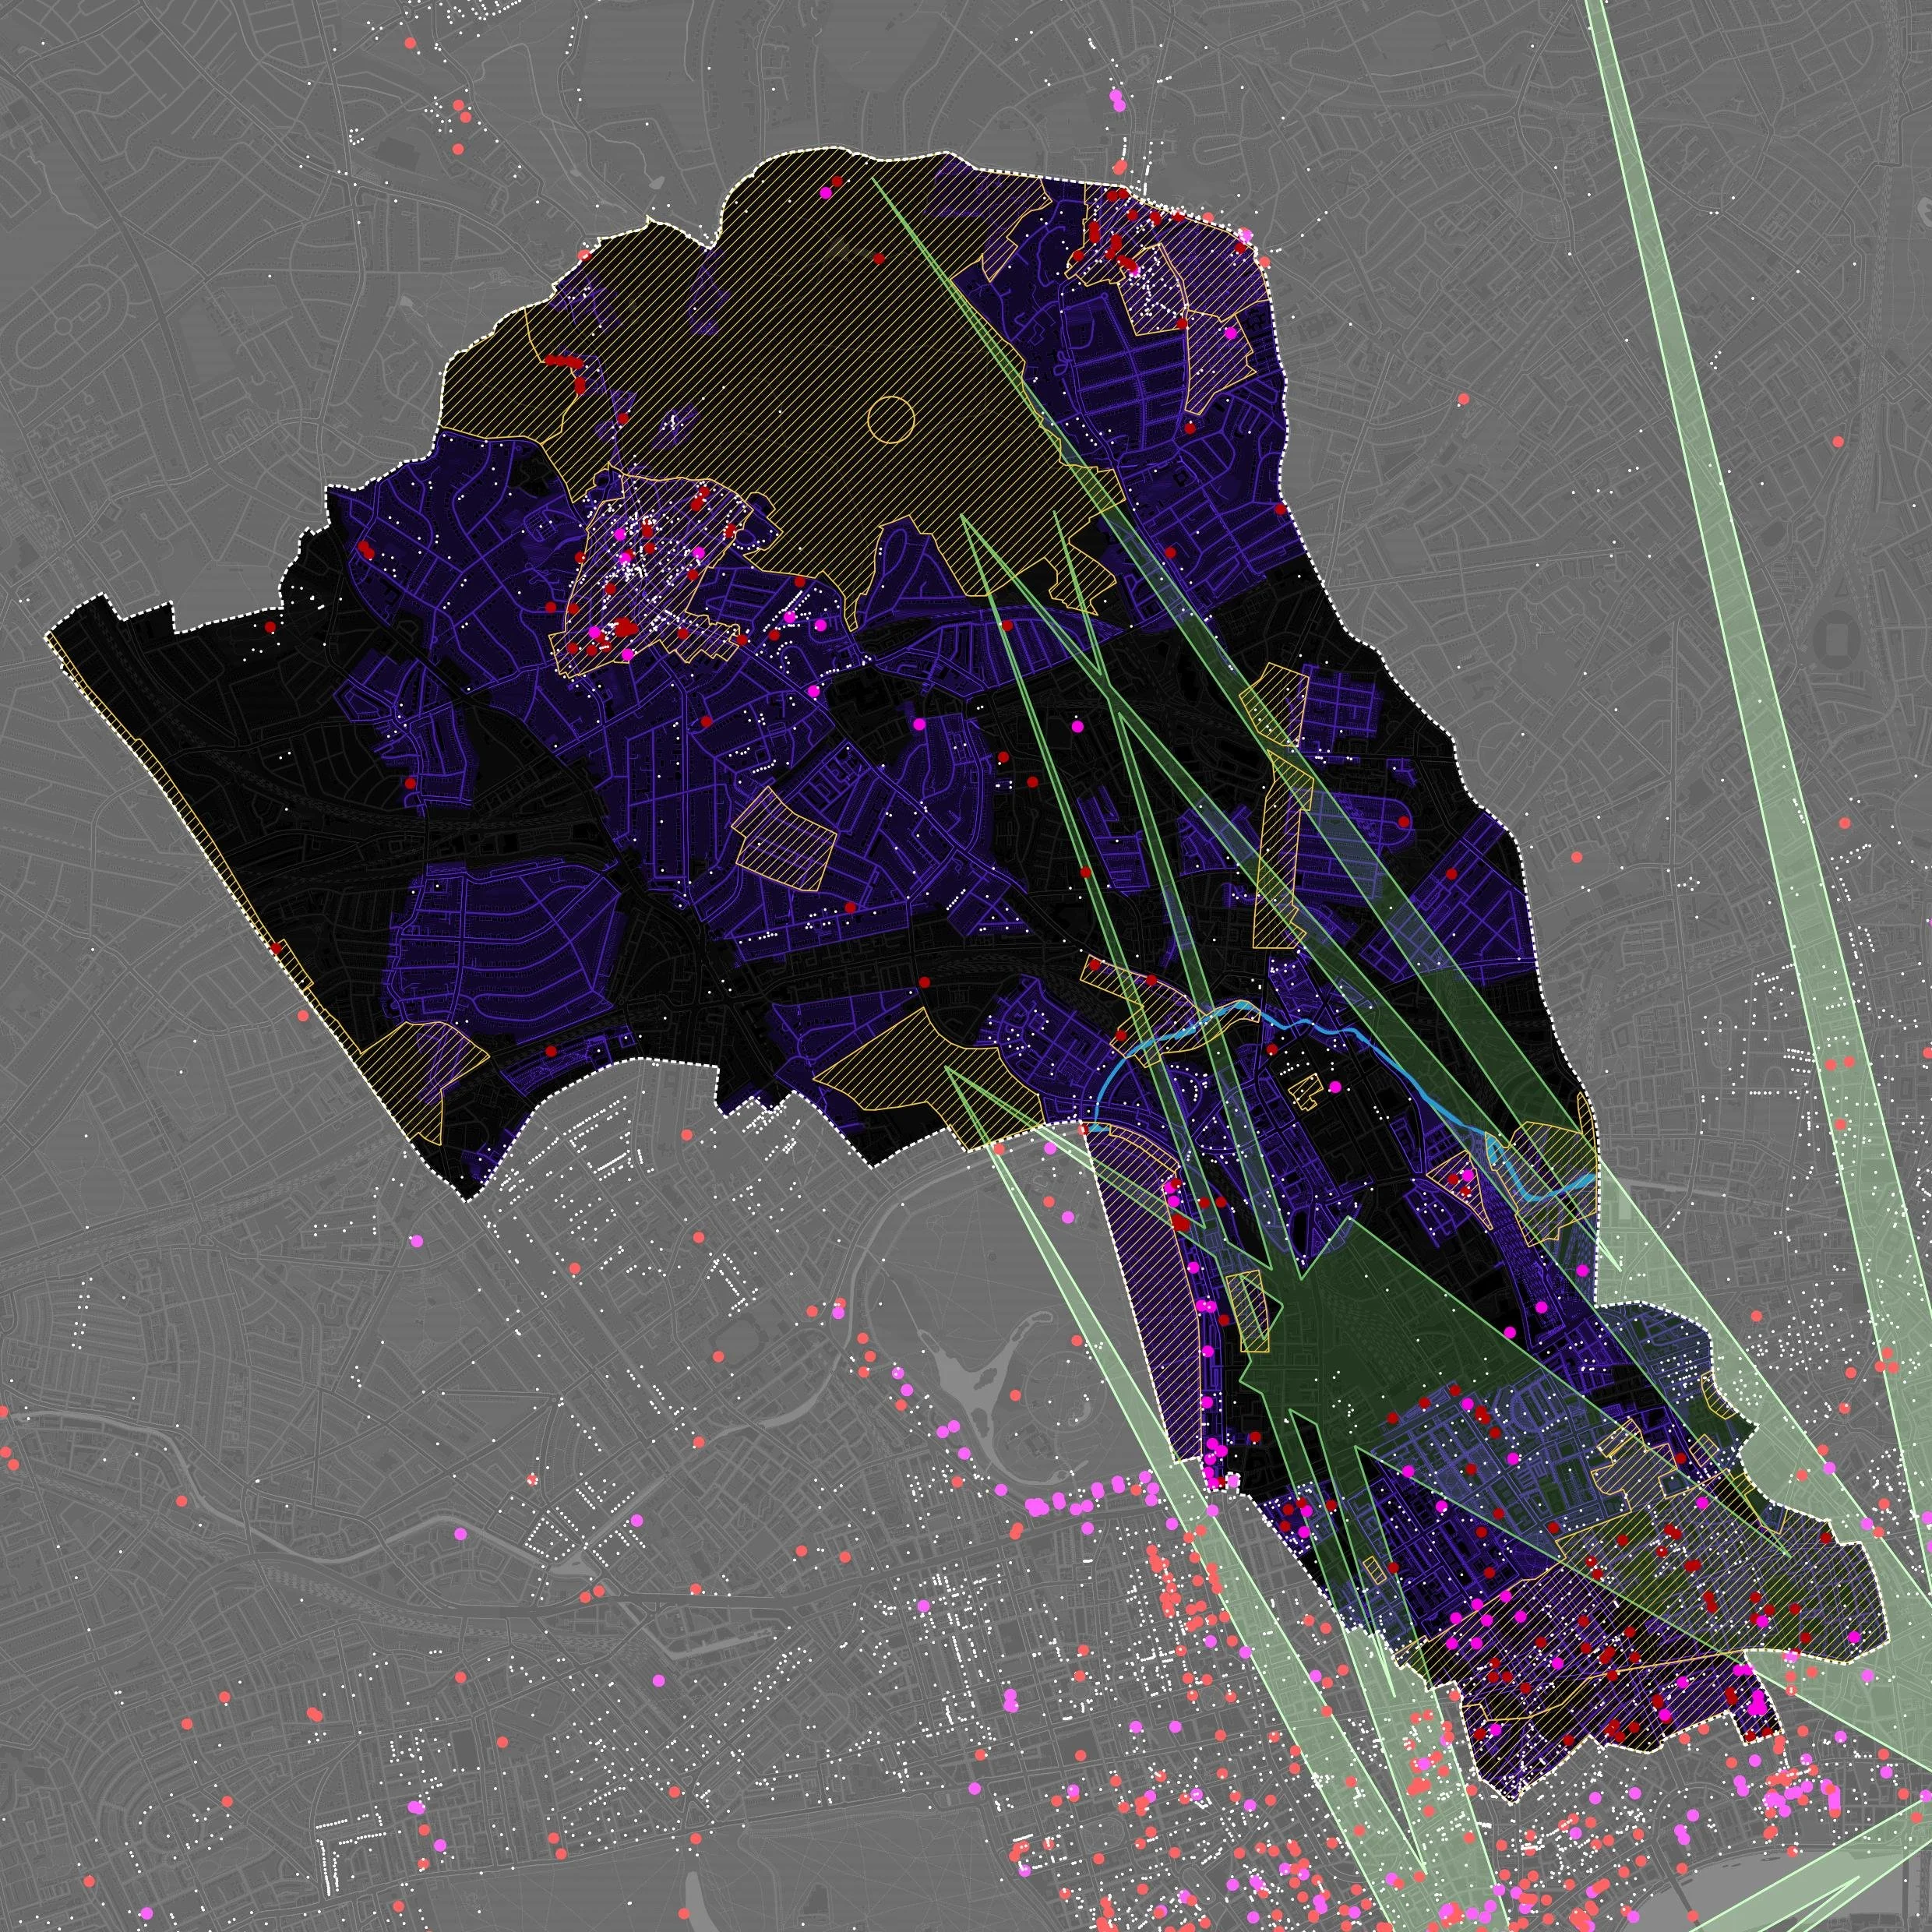
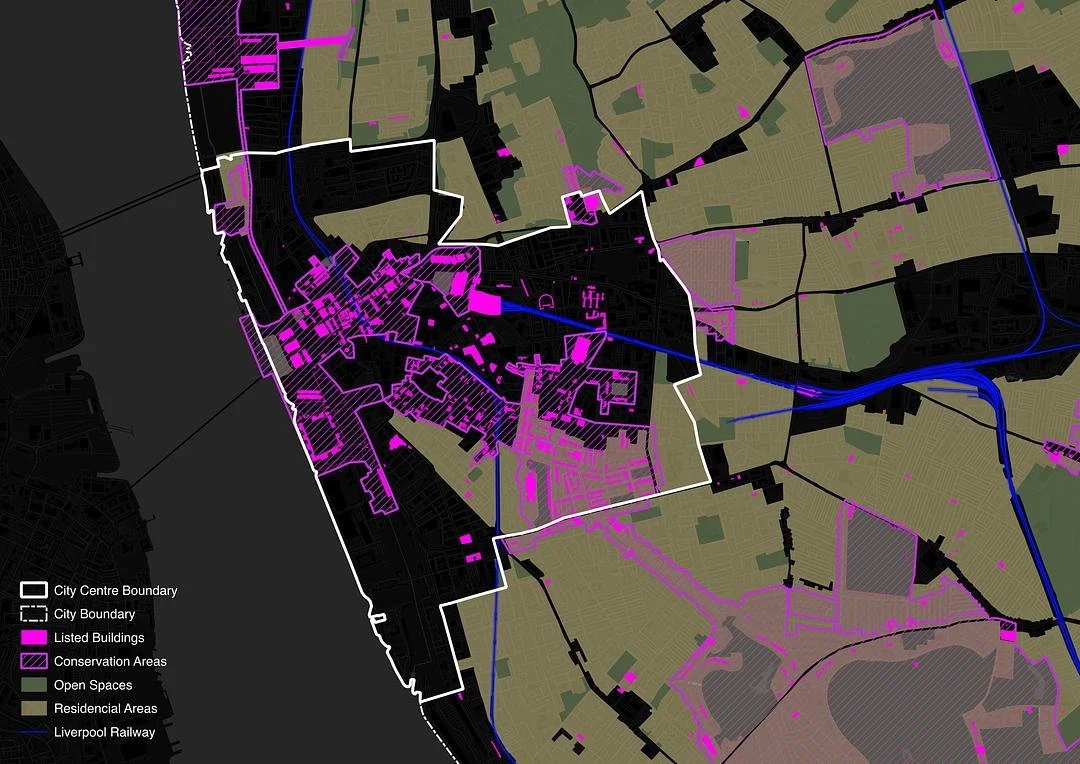
This is the kind of map you'll be able to make
Real outputs from Juan Pablo's QGIS work, spanning zoning, building heights, density, and cartographic basemaps. Each one applies the same principles you'll learn in the course.


Produce a complete map you'd be proud to send to a client
Your final deliverable pulls everything together: a single map that communicates a clear idea, uses the right map type, and is presented professionally.
Communicates a clear idea
Uses the right map type for the message
Has a strong, intentional visual hierarchy
Is clean, readable, and professionally presented
Meet your instructor

Juan Pablo Corral
Juan leads applied GIS training and spatial consulting at The GeoSpatial Hub. With over 10 years of experience in GIS and spatial analysis, he has trained 500+ urban professionals from across the globe and worked across the UK, Europe, the United States, and South America as a consultant and collaborator on a wide variety of urban and spatial projects.
An urban planner and architect, Juan holds a Master of City Design and Social Science from the London School of Economics and a Master of Architecture. He has taught GIS and urban planning at top universities and collaborated on research projects with the Harvard Graduate School of Design and the LSE.
& spatial analysis
trained worldwide
More than recordings. An interactive learning experience.
The course lives inside the All Things Urban Community Hub. You don't just watch videos. You learn alongside a global cohort of urban practitioners, with discussions, peer review, and direct feedback.
Tuesday and Thursday live sessions appear in your calendar. Recordings drop within 3 hours. Available to all students.
Videos, written instructions, GIFs, AI prompts, quizzes, and gentle reminders to keep you on track. Find what you need fast.
Access materials, sessions, and the community from any device. Set up approved by our previous students who appreciated the convenience.
Ask questions on any lesson. Juan and the cohort answer in context, not in a generic forum.
Post your maps in the community feed. Get feedback from peers and instructors before the final submission.
Connect with planners, architects, and designers from across the globe. Conversations continue after the cohort ends.
The All Things Urban Community Hub. Live for course members.
Trusted by urban professionals from leading organisations
Reviews from past students of GeoSpatial Hub GIS programs.
"It was concise, clear and with very useful practical tips."
"Thank you for this insightful course, which helped me overcome one of my biggest professional challenges (mastering complex computer programmes). Especially valuable to me was the personalised help during my work, as well as the final feedback after handing in my map."
"I wanted to do a GIS course a long time ago but I never found a fitting place or time, and this online version with recordings and exercises was perfect. I liked having real examples; in that way it was easier to grasp and apply the different tools."
"The most valuable part is that the GIS course is tailored for urban practitioners. It is a good stepping stone for students and professionals from architecture, urban design, and planning backgrounds towards spatial analysis."
"A QGIS course is essential for spatial data analysis, and I found the customized training highly valuable due to its expert trainers, interesting training materials, and excellent organization."
30% off at launch pricing.
Practitioners who already know QGIS basics, and want their maps to land
Minimum requirements
- Basic QGIS knowledge (layers, symbology, attribute tables)
- Understanding of vector data (points, lines, polygons)
- No prior design experience required
Not sure if your level is enough? Email us at community@allthingsurban.net with subject line "Advanced QGIS Visualization", explain your level, and we'll get back to you.
How AI fits in
AI is used to translate your ideas into QGIS expressions, build rule-based styling faster, and reduce time spent on syntax errors. You still decide what the map says, what matters, and how it should be interpreted.
Choose your path.
Two tiers. Same course materials. Pick the level of support that fits how you learn.
- 2 live classes with the instructor (June 9 & 16)
- Recordings available within 3 hours
- All course materials, exercises, quizzes
- QGIS project files, datasets, AI prompts
- 2 months of materials access from cohort start
- No Q&A or instructor feedback included
- Everything in Self-Paced, plus:
- 2 live Q&A sessions with the course instructor (June 11 & 18)
- Optional final exam with the instructor's personal review
- Live chat with the instructor and your cohort for feedback & support
- Certificate of completion (upon submission of the exam)
Apply for student discount →
Team licenses (3+ seats) and other questions: community@allthingsurban.net.
Get your employer to cover the course
This course typically pays for itself within two weeks of normal map production. Most firms have professional development budgets for exactly this kind of training. Here's everything you need to make the case.
Why it's worth covering
- 01Faster client deliverables. Maps that took half a day now take an hour. Compounds across every project.
- 02AI productivity gains. The course teaches AI-aided QGIS workflows that cut styling time 5–10×.
- 03Better stakeholder communication. Clearer maps mean stronger presentations to clients, councils, and decision-makers.
- 04Recognized instructor. Juan Pablo Corral has trained 500+ urban professionals from across the globe.
- 05Practical and immediately applicable. Live sessions over 2 weeks, recorded, with materials accessible for 2 months.
Get the employer brochure (PDF)
Fill in the form on this page to request the brochure. We'll email you the PDF link within minutes.
Email template. Copy & send
Adjust the bracketed fields and send to your manager.
Hi [Manager Name],
I'd like to enroll in Advanced QGIS Visualization & AI-Aided Styling for Urban Spatial Storytelling, a 2-week live cohort running June 5 to 18, 2026.
The course is delivered by The GeoSpatial Hub, a specialized training initiative by All Things Urban, the leading global career platform connecting 100,000+ urban professionals and organisations worldwide. It is led by Juan Pablo Corral, who holds a Master of City Design and Social Science from the London School of Economics and a Master of Architecture, and has trained 500+ urban professionals from across the globe with consultancy work across the UK, Europe, the United States, and South America.
Why I think it's worth covering:
- Direct impact on our client work. Better, faster maps mean clearer deliverables and stronger stakeholder presentations.
- AI productivity gains. The course teaches AI-aided workflows in QGIS that cut styling time by 5–10×. This compounds across every project.
- Recognized instructor. Juan Pablo Corral has trained 500+ urban professionals from across the globe.
- Practical and immediately applicable. Four live sessions on June 9, 11, 16, and 18, all recorded, plus 2 months of materials access.
- Cost-effective. The launch price (€249 / €349) is a fraction of typical professional development budgets, and the course pays for itself in time saved within roughly two weeks.
Course details: geospatial-hub.com/spatial-storytelling
A PDF brochure with all the details is available on the course website.
Thanks,
[Your name]
Need this for your team? We do custom trainings.
Most of our work happens at the team and organisation level. We design tailored GIS and spatial-analysis programs around your data, your projects, and your tools. Delivered as workshops, multi-week training series, or long-term capacity building.
Who we work with: urban planning departments, public agencies, architecture and design firms, consultancies, universities, research centres, NGOs, sustainability and climate teams.
What we deliver: applied workflows tailored to your team's data and decision-making, AI-aided QGIS integration, structured spatial analysis training, and ongoing capacity building with QA processes and onboarding documentation.
Topics we train teams on
- Advanced QGIS for urban analysis and visualization
- AI-aided spatial workflows and rule-based logic
- Urban storytelling with maps for client presentations
- Land cover, density, and accessibility analysis
- Mobility and transit network mapping
- Climate, environmental, and sustainability mapping
- Data management and standardised spatial workflows
- QA processes and reusable map templates
Tell us about your team's needs and we'll design a program: workshop, multi-week series, or long-term partnership.
The GeoSpatial Hub and this programme are powered by All Things Urban, a leading global career platform connecting 100,000+ urban professionals and organisations worldwide.
Common questions
Yes. Basic QGIS familiarity is required. You should be comfortable with layers, symbology, and attribute tables. We focus on intermediate-to-advanced visualization, not first-time setup.
No. We introduce AI as a styling assistant for QGIS expressions and rule-based logic. We'll show you exactly how to use it. No prior experience needed.
It's a 2-week structured cohort with self-paced materials, exercises, and quizzes you work through on your own time, combined with scheduled live sessions. Self-Paced (Tier 1) attends 2 live classes (June 9 & 16). Mentored (Tier 2) additionally attends 2 live Q&A sessions (June 11 & 18) and can submit an optional final exam (2 weeks to complete on your own time). All live sessions are recorded and available within 3 hours. Materials access is 2 months from enrollment.
No problem. Every live session is recorded and made available within 3 hours, so you can watch on your own schedule. Tier 2 students who miss a Q&A can still post their questions in the community chat for Juan to address asynchronously.
All four sessions run at 4:00 PM CEST / 10:00 AM EDT. For other regions: 7:00 AM PDT · 7:30 PM IST · 11:00 PM JST · 12:00 AM AEST (next day). If your time zone makes live attendance hard, the recordings cover everything within 3 hours.
Self-Paced includes all course materials, exercises, quizzes, project files, datasets, plus the 2 live classes (June 9 & 16). Perfect for independent learners who want to absorb the content and apply it. It does not include the Q&A sessions, instructor feedback, or certificate.
Mentored includes everything in Self-Paced, plus the 2 live Q&A sessions (June 11 & 18), an optional final exam with Juan's personal review, live chat with Juan and your cohort for ongoing feedback and support throughout the course, and a certificate of completion awarded after submission of the exam. Pick Mentored if you want feedback, certification, and the full mentored experience. The exam is optional and you have 2 weeks to complete it on your own time after the cohort ends.
Yes. Students get 40% off the standard price (€349 / €499). To apply, fill in our student discount form with proof of student status (university ID or current enrollment letter). We'll send you a discount code.
QGIS (free, open-source) and access to a general-purpose AI assistant. Datasets are provided.
Course materials are accessible for 2 months from enrollment. Tier 2's community chat is accessible for 1 month after the cohort starts. After those windows, materials and chat archives close.
Enrollment is processed through a secure Circle payout form. After payment, you'll receive course access details by email.